Journals > > Topics > Vision, Color, and Visual Optics
Vision, Color, and Visual Optics|122 Article(s)
Hue-Subregion Weighted Constrained Hue-Plane Preserving Camera Characterization
Yongheng Yin, Long Ma, and Peng Li
ObjectiveColor reproduction plays a very important role in textile, printing, telemedicine, and other industries, but affected by the manufacturing process or color rendering mechanism of digital image acquisition equipment, color image transmission between digital devices often has color distortion. Meanwhile, once the distortion appears, the above-mentioned industries will suffer losses or even irreversible damage. During color image acquisition, the most commonly employed acquisition equipment is the digital camera, which is an important method to convert the color image collected by the digital camera into the image seen by the human eye (or the camera characteristic method). Although the existing nonlinear camera characterization methods have the best camera characterization performance at present, these methods have hue distortion. To retain the important properties of the hue-plane preserving and further improve the camera characterization performance, we propose a hue-subregion weighted constrained hue-plane preserving camera characterization (HPPCC-NWCM) method.MethodsThe proposed method improves weighted constrained hue-plane preserving camera characterization from the perspective of optimizing the hue-subregion. First, the camera response value RGBs and the colorimetric value XYZs of the training samples are synchronously preprocessed, with the hue angles calculated and hue subregions preliminarily divided. Then, by operating in the hue subregion, the minimum hue angle differences between each training sample and the samples in the hue subregion are employed as the weighted power function, and the pre-calculation camera characterization matrices (pre-calculation matrices) are calculated for each sample respectively. Additionally, the weighted constrained normalized camera characterization matrix in the hue subregion is obtained by weighted averaging of the pre-calculation matrices using the weighted power function. Combined with the characterization results of samples within the hue subregion and all samples, the number and position of the hue subregions are optimized, and those under the best performance are obtained. To verify the performance improvement of this method, we conduct simulation experiments. Firstly, the hue-subregion number selection experiment is carried out by combining three cameras and three groups of object reflectance datasets under the D65 light illuminant. Then, the two cameras from the previous experimental data are compared with existing methods for further experiments and the exposure independence of each method is verified by changing the exposure level. Finally, the SFU dataset is compared with the existing methods repeatedly with 42 cameras under three light illuminants.Results and DiscussionsVerified by many simulation experiments and real camera experiments, in the simulation experiment of selecting the hue-subregion number, the camera characterization performance of this method is generally enhanced with the increasing hue-subregion number (Fig. 7), tends to stabilize when the number is 6, and yields the best performance when the number is 9. The performance of the subregion number 2 is worse than that of 1, and the analysis is that the small subregion number results in poor universality and low specificity of the characterization matrix in the hue subregion, which affects the characterization performance of the camera. After comparing the simulation experiment with the existing methods, the performance of this method is about 10% to 20% higher than those of the existing hue-plane preserving camera characterization methods, and it is better than or close to the nonlinear method (Table 1). In the variable exposure experiment, the performance of each method is close to that of the fixed exposure experiment, and that of the linear method and the root-polynomial method is close, which can prove the exposure independence. While the polynomial method is obviously worse, exposure independence does not exist (Tables 1 and 2). In the simulation experiments of supplementary light illuminants and cameras, the comparison trend of the results is basically the same as that of the previous experiment, and this method performs better in the supplementary experiment. In addition to being better than the existing camera characterization methods, it can be better than or equal to the nonlinear methods in many environments (Table 3).ConclusionsBy optimizing the hue subregion to improve the weighted constrained hue-plane preserving camera characterization method, the number and position of the hue subregion are optimized to achieve a more accurate camera characterization transformation for different hue subregions. By adopting the theoretical derivation and experimental verification of camera characterization transformation, this method features exposure independence, excellent hue-plane preservation properties, and the combination of the stability of low-order methods and the accuracy of high-order methods. In simulation experiments, it can be better than the existing hue-plane preservation methods, and better than or close to other nonlinear methods. In multi-camera supplementary experiments, the 95 percentile error improvement shows that this method has strong robustness and practical significance. ObjectiveColor reproduction plays a very important role in textile, printing, telemedicine, and other industries, but affected by the manufacturing process or color rendering mechanism of digital image acquisition equipment, color image transmission between digital devices often has color distortion. Meanwhile, once the distortion appears, the above-mentioned industries will suffer losses or even irreversible damage. During color image acquisition, the most commonly employed acquisition equipment is the digital camera, which is an important method to convert the color image collected by the digital camera into the image seen by the human eye (or the camera characteristic method). Although the existing nonlinear camera characterization methods have the best camera characterization performance at present, these methods have hue distortion. To retain the important properties of the hue-plane preserving and further improve the camera characterization performance, we propose a hue-subregion weighted constrained hue-plane preserving camera characterization (HPPCC-NWCM) method.MethodsThe proposed method improves weighted constrained hue-plane preserving camera characterization from the perspective of optimizing the hue-subregion. First, the camera response value RGBs and the colorimetric value XYZs of the training samples are synchronously preprocessed, with the hue angles calculated and hue subregions preliminarily divided. Then, by operating in the hue subregion, the minimum hue angle differences between each training sample and the samples in the hue subregion are employed as the weighted power function, and the pre-calculation camera characterization matrices (pre-calculation matrices) are calculated for each sample respectively. Additionally, the weighted constrained normalized camera characterization matrix in the hue subregion is obtained by weighted averaging of the pre-calculation matrices using the weighted power function. Combined with the characterization results of samples within the hue subregion and all samples, the number and position of the hue subregions are optimized, and those under the best performance are obtained. To verify the performance improvement of this method, we conduct simulation experiments. Firstly, the hue-subregion number selection experiment is carried out by combining three cameras and three groups of object reflectance datasets under the D65 light illuminant. Then, the two cameras from the previous experimental data are compared with existing methods for further experiments and the exposure independence of each method is verified by changing the exposure level. Finally, the SFU dataset is compared with the existing methods repeatedly with 42 cameras under three light illuminants.Results and DiscussionsVerified by many simulation experiments and real camera experiments, in the simulation experiment of selecting the hue-subregion number, the camera characterization performance of this method is generally enhanced with the increasing hue-subregion number (Fig. 7), tends to stabilize when the number is 6, and yields the best performance when the number is 9. The performance of the subregion number 2 is worse than that of 1, and the analysis is that the small subregion number results in poor universality and low specificity of the characterization matrix in the hue subregion, which affects the characterization performance of the camera. After comparing the simulation experiment with the existing methods, the performance of this method is about 10% to 20% higher than those of the existing hue-plane preserving camera characterization methods, and it is better than or close to the nonlinear method (Table 1). In the variable exposure experiment, the performance of each method is close to that of the fixed exposure experiment, and that of the linear method and the root-polynomial method is close, which can prove the exposure independence. While the polynomial method is obviously worse, exposure independence does not exist (Tables 1 and 2). In the simulation experiments of supplementary light illuminants and cameras, the comparison trend of the results is basically the same as that of the previous experiment, and this method performs better in the supplementary experiment. In addition to being better than the existing camera characterization methods, it can be better than or equal to the nonlinear methods in many environments (Table 3).ConclusionsBy optimizing the hue subregion to improve the weighted constrained hue-plane preserving camera characterization method, the number and position of the hue subregion are optimized to achieve a more accurate camera characterization transformation for different hue subregions. By adopting the theoretical derivation and experimental verification of camera characterization transformation, this method features exposure independence, excellent hue-plane preservation properties, and the combination of the stability of low-order methods and the accuracy of high-order methods. In simulation experiments, it can be better than the existing hue-plane preservation methods, and better than or close to other nonlinear methods. In multi-camera supplementary experiments, the 95 percentile error improvement shows that this method has strong robustness and practical significance.
Acta Optica Sinica
- Publication Date: May. 25, 2024
- Vol. 44, Issue 9, 0933001 (2024)

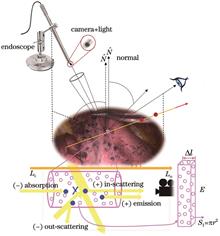
Dynamic Three-Dimensional Reconstruction of Soft Tissue in Neural Radiation Field for Robotic Surgery Simulators
Qi Chen, Zhibao Qin, Xiaoyu Cai, Shijie Li, Zijun Wang, Junsheng Shi, and Yonghang Tai
ObjectiveReconstructing soft tissue structures based on the endoscope position with robotic surgery simulators plays an important role in robotic surgery simulator training. Traditional soft tissue structure reconstruction is mainly achieved through surface reconstruction algorithms using medical imaging data sets such as computed tomography and magnetic resonance imaging. These methods fail to reconstruct the color information of soft tissue models and are not suitable for complex surgical scenes. Therefore, we proposed a method based on neural radiation fields, combined it with classic volume rendering to segment robotic surgery simulator scenes from videos with deformable soft tissue captured by a monocular stereoscopic endoscope, and performed three-dimensional reconstruction of biological soft tissue structures to restore soft tissue. By using segmented arbitrary scene model (SASM) for segmentation modeling of time-varying objects and time-invariant objects in videos, specific dynamic occlusions in surgical scenes can be removed.MethodsInspired by recent advances in neural radiation fields, we first constructed a self-supervision-based framework that extracted multi-view images from monocular stereoscopic endoscopic videos and used the underlying 3D information in the images to construct geometric constraints of objects, so as to accurately reconstruct soft tissue structures. Then, the SASM was used to segment and decouple the dynamic surgical instruments, static abdominal scenes, and deformable soft tissue structures under the endoscope. In addition, this framework used a simple neural network multilayer perceptron (MLP) to represent moving surgical instruments and deformed soft tissue structures in dynamic neural radiation fields and proposed skew entropy loss to correctly predict surgical instruments, cavity scenes, and soft tissue structures in surgical scenes.Results and DiscussionsWe employ MLP to represent robotic surgery simulator scenes in the neural radiation field to accommodate the inherent geometric complexity and deformable soft tissue. Furthermore, we establish a hybrid framework of the neural radiation field and SASM for efficient characterization and segmentation of endoscopic surgical scenes in an endoscopic robotic surgery simulator. To address the dynamic nature of scenes and facilitate accurate scene separation, we propose a self-supervised approach incorporating a novel loss function. For validation, we perform a comprehensive quantitative and qualitative evaluation of a data set captured using a stereoendoscope, including simulated robotic surgery scenes from different angles and distances. The results show that our method performs well in synthesizing realistic robotic surgery simulator scenes compared with existing methods, with an average improvement of 12.5% in peak signal-to-noise ratio (PSNR) and an average improvement of 8.43% in structural similarity (Table 1). It shows excellent results and performance in simulating scenes and achieving high-fidelity reconstruction of biological soft tissue structures, color, textures, and other details. Furthermore, our method shows significant efficacy in scene segmentation, enhancing overall scene understanding and accuracy.ConclusionsWe propose a novel NeRF-based framework for self-supervised 3D dynamic surgical scene decoupling and biological soft tissue reconstruction from arbitrary multi-viewpoint monocular stereoscopic endoscopic videos. Our method decouples dynamic surgical instrument occlusion and deformable soft tissue structures, recovers a static abdominal volume background representation, and enables high-quality new view synthesis. The key parts of our framework are the SASM and the neural radiation field. The highly segmentable module of SASM decomposes the surgical scene into dynamic, static, and deformable regions. A spatiotemporal hybrid representation is then designed to facilitate and efficiently model the decomposed neural radiation fields. Our method achieves excellent performance in various simulation scenes of robotic surgery data, such as large-scale moving surgical instruments and 3D reconstruction of deformable soft tissue structures. We believe that our method can facilitate robotic surgery simulator scene understanding and hope that emerging NeRF-based 3D reconstruction technology can provide inspiration for robotic surgery simulator scene understanding and empower various downstream clinically oriented tasks. ObjectiveReconstructing soft tissue structures based on the endoscope position with robotic surgery simulators plays an important role in robotic surgery simulator training. Traditional soft tissue structure reconstruction is mainly achieved through surface reconstruction algorithms using medical imaging data sets such as computed tomography and magnetic resonance imaging. These methods fail to reconstruct the color information of soft tissue models and are not suitable for complex surgical scenes. Therefore, we proposed a method based on neural radiation fields, combined it with classic volume rendering to segment robotic surgery simulator scenes from videos with deformable soft tissue captured by a monocular stereoscopic endoscope, and performed three-dimensional reconstruction of biological soft tissue structures to restore soft tissue. By using segmented arbitrary scene model (SASM) for segmentation modeling of time-varying objects and time-invariant objects in videos, specific dynamic occlusions in surgical scenes can be removed.MethodsInspired by recent advances in neural radiation fields, we first constructed a self-supervision-based framework that extracted multi-view images from monocular stereoscopic endoscopic videos and used the underlying 3D information in the images to construct geometric constraints of objects, so as to accurately reconstruct soft tissue structures. Then, the SASM was used to segment and decouple the dynamic surgical instruments, static abdominal scenes, and deformable soft tissue structures under the endoscope. In addition, this framework used a simple neural network multilayer perceptron (MLP) to represent moving surgical instruments and deformed soft tissue structures in dynamic neural radiation fields and proposed skew entropy loss to correctly predict surgical instruments, cavity scenes, and soft tissue structures in surgical scenes.Results and DiscussionsWe employ MLP to represent robotic surgery simulator scenes in the neural radiation field to accommodate the inherent geometric complexity and deformable soft tissue. Furthermore, we establish a hybrid framework of the neural radiation field and SASM for efficient characterization and segmentation of endoscopic surgical scenes in an endoscopic robotic surgery simulator. To address the dynamic nature of scenes and facilitate accurate scene separation, we propose a self-supervised approach incorporating a novel loss function. For validation, we perform a comprehensive quantitative and qualitative evaluation of a data set captured using a stereoendoscope, including simulated robotic surgery scenes from different angles and distances. The results show that our method performs well in synthesizing realistic robotic surgery simulator scenes compared with existing methods, with an average improvement of 12.5% in peak signal-to-noise ratio (PSNR) and an average improvement of 8.43% in structural similarity (Table 1). It shows excellent results and performance in simulating scenes and achieving high-fidelity reconstruction of biological soft tissue structures, color, textures, and other details. Furthermore, our method shows significant efficacy in scene segmentation, enhancing overall scene understanding and accuracy.ConclusionsWe propose a novel NeRF-based framework for self-supervised 3D dynamic surgical scene decoupling and biological soft tissue reconstruction from arbitrary multi-viewpoint monocular stereoscopic endoscopic videos. Our method decouples dynamic surgical instrument occlusion and deformable soft tissue structures, recovers a static abdominal volume background representation, and enables high-quality new view synthesis. The key parts of our framework are the SASM and the neural radiation field. The highly segmentable module of SASM decomposes the surgical scene into dynamic, static, and deformable regions. A spatiotemporal hybrid representation is then designed to facilitate and efficiently model the decomposed neural radiation fields. Our method achieves excellent performance in various simulation scenes of robotic surgery data, such as large-scale moving surgical instruments and 3D reconstruction of deformable soft tissue structures. We believe that our method can facilitate robotic surgery simulator scene understanding and hope that emerging NeRF-based 3D reconstruction technology can provide inspiration for robotic surgery simulator scene understanding and empower various downstream clinically oriented tasks.
Acta Optica Sinica
- Publication Date: Apr. 10, 2024
- Vol. 44, Issue 7, 0733001 (2024)

Dynamic Distortion Assessment in Automobile Head-Up Displays with Subjective Methods
Tao Wang, and Haifeng Li
ObjectiveIn the automobile augmented reality head-up display (AR-HUD) optical system, due to its imaging performance and the non-standard shape of the windshield on the last imaging surface, the image observed by the driver will have some distortion. Meanwhile, as the viewpoint changes in the eyebox, the distortion will also be different at various eyebox positions, which will cause great trouble to the driver's perception during driving. At present, there have been a lot of studies on the distortion correction of AR-HUD, such as employing algorithm correction or adding optimization functions during optical design. However, the above-mentioned distortion correction methods are all for distortion correction at a single viewpoint. The binocular fusion process of human eyes is not involved. Since the image observed by the driver is essentially the fusion of distorted images of the left and right eyes at different eyebox positions, monocular correction alone cannot well represent the experience of the drivers during the binocular fusion processes. Therefore, it is necessary to conduct corresponding subjective experiments to evaluate the actual perception of the driver during the fusion process of different viewpoint images and provide certain constraints of dynamic distortion for the optical design process.MethodsWe adopt homogeneity of variance test, one-way ANOVA, and statistical chart analysis. First, we conduct a basic theoretical explanation of dynamic distortion and how to simulate dynamic distortion, build a dynamic distortion experimental simulation model, and synthesize a series of display images for later subjective experiments. Then we utilize the subjective experimental scale and carry out a subjective experiment for dynamic distortion evaluation. Experimental data from multiple subjects in different group conditions are collected in this section. Finally, statistical methods are leveraged to analyze previously obtained data, with one-way ANOVA and chart analysis processed in this section. Additionally, significant difference results and line-bar charts are employed to simultaneously analyze the experimental data quantitatively and visually find the relationship between dynamic distortion and drivers' subjective perception.Results and DiscussionsA total of three sets of results of 12 subjects for vertical, horizontal, and rotational distortion are calculated using the homogeneous test of variances. As shown in Table 1, the Levene statistics are 2.301, 0.988, and 1.401, respectively, and the corresponding difference significance values are 0.051, 0.435, and 0.241, respectively, all greater than 0.05, indicating that the statistical quantities of the three sets of data have homogeneity of variances and the F test can be adopted to perform one-way ANOVA. Then three groups of data are subjected to single-factor variance analysis with VIMSL in subjective experiments. In the ANOVA analysis results, the significant difference values of vertical distortion and rotational distortion are both 0, less than 0.01. The results show that the factor dynamic distortion level has a significant effect on the VIMSL increments. However, the significant difference value of horizontal distortion is greater than 0.05, which means that the changes in the horizontal direction have a small effect on drivers' perception and there is no obvious significant effect on the VIMSL increments. In the statistical chart analysis (Figs. 10-11), as the distortion level increases, VIMSL-related evaluation indicators rise accordingly. There is a more obvious difference between Group 2 and Group 3, which shows that drivers' discomfort increases most significantly during the switching process between the two groups. This means that vertical distortion of 2% and horizontal distortion of 1% can be regarded as a value at which obvious discomfort begins to occur. However, the SSQ scores do not change significantly before and after viewing, which shows that the influence of the experimental equipment on subjects' discomfort can be ignored and the display condition of the experimental equipment itself is relatively reliable.ConclusionsWe establish a subjective experimental procedure based on binocular 3D display observation and the subjective experimental data are adopted to analyze the subjective feelings of drivers caused by dynamic distortion in automobile AR-HUD devices. Meanwhile, the certain value of the distortion level that is acceptable to the drivers during binocular fusion when drivers are watching the images from different eyebox positions is evaluated. The experimental results show that different forms and levels of dynamic distortion both have a great effect on the driver's subjective perception. As the difference in dynamic distortion between the two eyes rises, it becomes increasingly more difficult for the driver to fuse the images, with rapidly increased discomfort level. Furthermore, we also reveal that the certain levels for the dynamic distortion acceptable to the driver at two different positions of the same eyebox are vertical distortion less than 2% and horizontal distortion less than 1%. The results show that the combination of different distortions has a great effect on the driver's subjective perception. Additionally, the experimental results also provide a clear design constraint index for dynamic distortion correction during the HUD optical design. ObjectiveIn the automobile augmented reality head-up display (AR-HUD) optical system, due to its imaging performance and the non-standard shape of the windshield on the last imaging surface, the image observed by the driver will have some distortion. Meanwhile, as the viewpoint changes in the eyebox, the distortion will also be different at various eyebox positions, which will cause great trouble to the driver's perception during driving. At present, there have been a lot of studies on the distortion correction of AR-HUD, such as employing algorithm correction or adding optimization functions during optical design. However, the above-mentioned distortion correction methods are all for distortion correction at a single viewpoint. The binocular fusion process of human eyes is not involved. Since the image observed by the driver is essentially the fusion of distorted images of the left and right eyes at different eyebox positions, monocular correction alone cannot well represent the experience of the drivers during the binocular fusion processes. Therefore, it is necessary to conduct corresponding subjective experiments to evaluate the actual perception of the driver during the fusion process of different viewpoint images and provide certain constraints of dynamic distortion for the optical design process.MethodsWe adopt homogeneity of variance test, one-way ANOVA, and statistical chart analysis. First, we conduct a basic theoretical explanation of dynamic distortion and how to simulate dynamic distortion, build a dynamic distortion experimental simulation model, and synthesize a series of display images for later subjective experiments. Then we utilize the subjective experimental scale and carry out a subjective experiment for dynamic distortion evaluation. Experimental data from multiple subjects in different group conditions are collected in this section. Finally, statistical methods are leveraged to analyze previously obtained data, with one-way ANOVA and chart analysis processed in this section. Additionally, significant difference results and line-bar charts are employed to simultaneously analyze the experimental data quantitatively and visually find the relationship between dynamic distortion and drivers' subjective perception.Results and DiscussionsA total of three sets of results of 12 subjects for vertical, horizontal, and rotational distortion are calculated using the homogeneous test of variances. As shown in Table 1, the Levene statistics are 2.301, 0.988, and 1.401, respectively, and the corresponding difference significance values are 0.051, 0.435, and 0.241, respectively, all greater than 0.05, indicating that the statistical quantities of the three sets of data have homogeneity of variances and the F test can be adopted to perform one-way ANOVA. Then three groups of data are subjected to single-factor variance analysis with VIMSL in subjective experiments. In the ANOVA analysis results, the significant difference values of vertical distortion and rotational distortion are both 0, less than 0.01. The results show that the factor dynamic distortion level has a significant effect on the VIMSL increments. However, the significant difference value of horizontal distortion is greater than 0.05, which means that the changes in the horizontal direction have a small effect on drivers' perception and there is no obvious significant effect on the VIMSL increments. In the statistical chart analysis (Figs. 10-11), as the distortion level increases, VIMSL-related evaluation indicators rise accordingly. There is a more obvious difference between Group 2 and Group 3, which shows that drivers' discomfort increases most significantly during the switching process between the two groups. This means that vertical distortion of 2% and horizontal distortion of 1% can be regarded as a value at which obvious discomfort begins to occur. However, the SSQ scores do not change significantly before and after viewing, which shows that the influence of the experimental equipment on subjects' discomfort can be ignored and the display condition of the experimental equipment itself is relatively reliable.ConclusionsWe establish a subjective experimental procedure based on binocular 3D display observation and the subjective experimental data are adopted to analyze the subjective feelings of drivers caused by dynamic distortion in automobile AR-HUD devices. Meanwhile, the certain value of the distortion level that is acceptable to the drivers during binocular fusion when drivers are watching the images from different eyebox positions is evaluated. The experimental results show that different forms and levels of dynamic distortion both have a great effect on the driver's subjective perception. As the difference in dynamic distortion between the two eyes rises, it becomes increasingly more difficult for the driver to fuse the images, with rapidly increased discomfort level. Furthermore, we also reveal that the certain levels for the dynamic distortion acceptable to the driver at two different positions of the same eyebox are vertical distortion less than 2% and horizontal distortion less than 1%. The results show that the combination of different distortions has a great effect on the driver's subjective perception. Additionally, the experimental results also provide a clear design constraint index for dynamic distortion correction during the HUD optical design.
Acta Optica Sinica
- Publication Date: Mar. 10, 2024
- Vol. 44, Issue 5, 0533001 (2024)
Color Constancy Algorithm Using Ambient Light Sensor
Yuemin Li, Haisong Xu, Yiming Huang, Minhang Yang, Bing Hu, and Yuntao Zhang
ObjectiveColor constancy is a fundamental characteristic of human vision that refers to the ability of correcting color deviations caused by a difference in illumination. However, digital cameras cannot automatically remove the color cast of the illumination, and the color bias is adjusted by correcting the image with illuminant estimation, generally executed by color constancy algorithms. As an essential part of image signal processing, color constancy algorithms are critical for improving image quality and accuracy of computer vision tasks. Substantial efforts have been made to develop illuminant estimation methods, resulting in the proliferation of statistical- and learning-based algorithms. The existing color constancy algorithms usually allow one to obtain accurate and stable illuminant estimation on conventional scenes. However, unacceptable errors may often arise on the low color complexity scenes with monotonous content and uniformly colored large surfaces due to the lack of hints about the illuminant color. To address these problems, this study proposes a color constancy algorithm with ambient light sensors (ALS) to improve the accuracy of illuminant estimation in scenes with low color complexity. This approach leverages the fact that most intelligent terminals are equipped with ALS, and can enhance illuminant estimation accuracy by using ALS measurements alongside the image content.MethodsThe color constancy algorithm proposed in this study comprises two steps. The first step involves evaluating the reliability of the ALS measurement using a confidence assessment model, based on which the illuminant estimation is performed using the appropriate method. The reliability of the ALS is affected by the relative position of the ALS and the light source. Therefore, a bagging tree classifier is trained to serve as the confidence assessment model, with the posture of the camera, the color complexity of the image, and Duv (distance from the black body locus) of the estimated illuminant chromaticity as input parameters. Two illuminant estimation methods are designed for different levels of confidence. When the confidence of the ALS measurement is high, the illuminant estimation is performed by color space transformation from the ALS response to camera RGB via a second-order root polynomial model. This model is trained by minimizing the mean angular error of the training samples. Furthermore, if the ALS measurement has low confidence and the base algorithm has high confidence, illuminant estimation is performed by extracting neutral pixels using a mask determined by the ALS measurement and illuminant distribution characteristics based on the results of the existing neutral color extracting methods (Fig. 2). Finally, if both the ALS measurement and base algorithm have low confidence, the illuminant color is obtained by averaging the results of the two methods mentioned above. To evaluate the proposed ALS based color constancy algorithm (ALS-based CC), a dataset was collected using a Nikon D3X camera mounted with TCS3440 ALS. The dataset includes both conventional and low color complexity scenes from indoors and outdoors (Fig. 5), illuminated by light sources with a wide range of chromaticity (Fig. 4). In each image of the dataset, a classic color checker was positioned as a label, which was masked out during the evaluation.Results and DiscussionsThe confidence assessment model of the ALS is trained and tested using 50 and 20 samples, respectively, collected using the aforementioned setup. It is demonstrated that the confidence assessment model correctly identifies all of the low confidence testing samples, but misjudges some of the high confidence ones (Table 2). The ALS-based CC, whose parameters were determined based on the performance evaluated by statistics of angular error, is executed with Grey Pixels (GP) as the base algorithm for neutral pixel extraction. The performance of ALS-based CC is compared with statistical-based counterparts using the established dataset. The results show that our proposed algorithm outperforms the counterparts in terms of the mean, tri-mean, and median of angular errors among the testing samples, indicating its overall high accuracy. Moreover, ALS-based CC achieves an angular error of less than 5° on the mean of the worst 25% of angular errors, demonstrating its excellent stability even in challenging scenes (Table 3). In terms of the visualization of typical scenes, ALS-based CC accurately estimates the illuminant most of the time, resulting in processed images that are largely consistent with the ground truth. However, all the counterparts perform poorly on some of the scenes with large pure color surfaces, resulting in quality degradation in their corrected images due to significant color bias (Fig. 6). Furthermore, the operation time of ALS-based CC is reduced to 66% of GP on MATLAB 2021b, suggesting its potential for real-time illuminant estimation applications.ConclusionsThis study proposes a color constancy algorithm that integrates the ALS with the camera to improve illuminant estimation accuracy in scenes with low color complexity. The algorithm consists of a confidence assessment model for the ALS and two illuminant estimation methods based on color space transformation and neutral pixel extraction, designed for different confidence levels. Furthermore, a dataset with ALS measurement was established to evaluate the algorithm, and the results show that mean, median, and mean of worst 25% angular errors of the proposed method decrease by 32%, 21%, and 41%, respectively, compared with the existing most accurate method. The proposed algorithm also has a potential for real-time illuminant estimation in both conventional and low color complexity scenes. ObjectiveColor constancy is a fundamental characteristic of human vision that refers to the ability of correcting color deviations caused by a difference in illumination. However, digital cameras cannot automatically remove the color cast of the illumination, and the color bias is adjusted by correcting the image with illuminant estimation, generally executed by color constancy algorithms. As an essential part of image signal processing, color constancy algorithms are critical for improving image quality and accuracy of computer vision tasks. Substantial efforts have been made to develop illuminant estimation methods, resulting in the proliferation of statistical- and learning-based algorithms. The existing color constancy algorithms usually allow one to obtain accurate and stable illuminant estimation on conventional scenes. However, unacceptable errors may often arise on the low color complexity scenes with monotonous content and uniformly colored large surfaces due to the lack of hints about the illuminant color. To address these problems, this study proposes a color constancy algorithm with ambient light sensors (ALS) to improve the accuracy of illuminant estimation in scenes with low color complexity. This approach leverages the fact that most intelligent terminals are equipped with ALS, and can enhance illuminant estimation accuracy by using ALS measurements alongside the image content.MethodsThe color constancy algorithm proposed in this study comprises two steps. The first step involves evaluating the reliability of the ALS measurement using a confidence assessment model, based on which the illuminant estimation is performed using the appropriate method. The reliability of the ALS is affected by the relative position of the ALS and the light source. Therefore, a bagging tree classifier is trained to serve as the confidence assessment model, with the posture of the camera, the color complexity of the image, and Duv (distance from the black body locus) of the estimated illuminant chromaticity as input parameters. Two illuminant estimation methods are designed for different levels of confidence. When the confidence of the ALS measurement is high, the illuminant estimation is performed by color space transformation from the ALS response to camera RGB via a second-order root polynomial model. This model is trained by minimizing the mean angular error of the training samples. Furthermore, if the ALS measurement has low confidence and the base algorithm has high confidence, illuminant estimation is performed by extracting neutral pixels using a mask determined by the ALS measurement and illuminant distribution characteristics based on the results of the existing neutral color extracting methods (Fig. 2). Finally, if both the ALS measurement and base algorithm have low confidence, the illuminant color is obtained by averaging the results of the two methods mentioned above. To evaluate the proposed ALS based color constancy algorithm (ALS-based CC), a dataset was collected using a Nikon D3X camera mounted with TCS3440 ALS. The dataset includes both conventional and low color complexity scenes from indoors and outdoors (Fig. 5), illuminated by light sources with a wide range of chromaticity (Fig. 4). In each image of the dataset, a classic color checker was positioned as a label, which was masked out during the evaluation.Results and DiscussionsThe confidence assessment model of the ALS is trained and tested using 50 and 20 samples, respectively, collected using the aforementioned setup. It is demonstrated that the confidence assessment model correctly identifies all of the low confidence testing samples, but misjudges some of the high confidence ones (Table 2). The ALS-based CC, whose parameters were determined based on the performance evaluated by statistics of angular error, is executed with Grey Pixels (GP) as the base algorithm for neutral pixel extraction. The performance of ALS-based CC is compared with statistical-based counterparts using the established dataset. The results show that our proposed algorithm outperforms the counterparts in terms of the mean, tri-mean, and median of angular errors among the testing samples, indicating its overall high accuracy. Moreover, ALS-based CC achieves an angular error of less than 5° on the mean of the worst 25% of angular errors, demonstrating its excellent stability even in challenging scenes (Table 3). In terms of the visualization of typical scenes, ALS-based CC accurately estimates the illuminant most of the time, resulting in processed images that are largely consistent with the ground truth. However, all the counterparts perform poorly on some of the scenes with large pure color surfaces, resulting in quality degradation in their corrected images due to significant color bias (Fig. 6). Furthermore, the operation time of ALS-based CC is reduced to 66% of GP on MATLAB 2021b, suggesting its potential for real-time illuminant estimation applications.ConclusionsThis study proposes a color constancy algorithm that integrates the ALS with the camera to improve illuminant estimation accuracy in scenes with low color complexity. The algorithm consists of a confidence assessment model for the ALS and two illuminant estimation methods based on color space transformation and neutral pixel extraction, designed for different confidence levels. Furthermore, a dataset with ALS measurement was established to evaluate the algorithm, and the results show that mean, median, and mean of worst 25% angular errors of the proposed method decrease by 32%, 21%, and 41%, respectively, compared with the existing most accurate method. The proposed algorithm also has a potential for real-time illuminant estimation in both conventional and low color complexity scenes.
Acta Optica Sinica
- Publication Date: Jul. 25, 2023
- Vol. 43, Issue 14, 1433001 (2023)
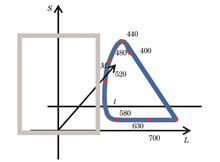
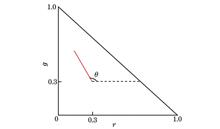
Experimental Research on Binocular Hue Cancellation Phenomenon
Mengshi Dai, Xiaoqiao Huang, Zaiqing Chen, Yonghang Tai, and Junsheng Shi
ObjectiveThe application of stereoscopic display, virtual reality, and head-mounted devices requires research on binocular properties of the human vision system (HVS). Threshold measurement is one method to investigate the characteristics of visual perception. At the same time, there are some color vision phenomena related to binocular vision systems that cannot be explained. One of the phenomena is called hue cancellation, which can also occur in binocular vision. Thus, it is called binocular hue cancellation and is a special phenomenon in binocular color fusion. Currently, most studies on binocular color fusion focus on the reproduction of glossiness in binocular color fusion, quantitative measurement of the thresholds of binocular color fusion, and the distinction between binocular color fusion and rivalry. However, as far as we know, no particular studies on binocular hue cancellation have been reported. To investigate the color vision mechanism of this particular phenomenon, we design a psychophysical experiment. We also investigate the opposite color directions and hue cancellation thresholds within the binocular color fusion that can perceive gray in the CIELAB color space and represent the experimental results in the LMS, Macleod-Boynton, and DKL color spaces respectively to provide experimental data for exploring the visual properties of HVS and the mechanism of binocular color.MethodsWe research a Samsung 3D display (S23A950D) with 2D/3D switching capability, requiring the observer to wear specific 3D switching glasses to obtain binocular vision. Eight opposite color directions are selected at 22.5° intervals in the isoluminance plane of CIELAB color space, and color stimulus sample pairs are selected at equal intervals in each direction (Fig. 4). The experiment is conducted among five college students between the ages of 22 and 25 with normal vision, and each of them experiences at least 19800 color stimuli. We carry out the experiment in a dark room and first employ the adjustment method to determine the opposite color directions in which the binocular hue cancellation phenomenon could occur and the initial values of the binocular hue cancellation thresholds. Then the limit method is adopted to accurately determine the binocular hue cancellation thresholds.Results and DiscussionsThe experimental results show that binocular hue cancellation phenomenon could occur only when red-green (R-G), yellow-blue (Y-B), and yellow green-purple (YG-P) color pairs are combined (Fig. 6). The binocular hue cancellation thresholds of the five observers are expressed in the CIELAB, LMS, Macleod-Boynton, and DKL color spaces respectively. In the CIELAB color space, the range of binocular hue cancellation thresholds in the R-G color direction is 11.36-13.58, with a mean value of 13.03, and the range of thresholds in the Y-B direction is 8.14-10.07, with a mean value of 9.25. The range of thresholds in the YG-P direction is 11.26-15.55, with a mean value of 13.02. Among them, the Y-B combination has the smallest threshold, and the average thresholds of the R-G and YG-P combinations are almost equal (Table 2). After exchanging the colors viewed by the left and right eyes, the obtained binocular hue cancellation thresholds are similar, which indicates that the dominant eye does not affect the binocular hue cancellation phenomenon. Five observers are largely different in thresholds of the YG-P direction, and one of them has much smaller thresholds in the R-G direction than the others, showing individual differences in the binocular hue cancellation phenomenon (Fig. 7). In the LMS color space, the six color directions are uniformly distributed and almost divide the L-M plane into six equal parts. The color directions in the L-M plane and the L-S plane are symmetric about the S axis, and the thresholds in the L-M plane are shown as a straight line parallel to the S axis (Fig. 8). In the Macleod-Boynton chromaticity diagram, the binocular hue cancellation thresholds of six colors are close to the white point, indicating the saturation of the colors which can produce the binocular hue cancellation phenomenon is low (Fig. 9). In DKL space, the direction of YG-P overlaps with the cardinal direction S-(L+M), while the directions of R-G, Y-B, and the cardinal direction L-M are not close to each other (Fig. 10).ConclusionsThe binocular hue cancellation phenomenon is investigated through a visual psychophysics experimental method. The results show that the particular phenomenon can only occur in three color directions of red-green, yellow-blue, and yellow green-purple, which means observers can only perceive gray in the three directions. There are individual differences in binocular hue cancellation thresholds of the five observers, but the thresholds in the yellow-blue direction are all minimal. Because the study on visual mechanisms is strongly related to the choice of color space, the binocular hue cancellation thresholds of the five observers are expressed in the color spaces of CIELAB, LMS, Macleod-Boynton, and DKL respectively. The binocular hue cancellation directions are more uniformly distributed in LMS, Macleod-Boynton, and DKL color space approximately in six equal parts, implying the specificity of these six hues. The binocular hue cancellation threshold occupies only a small range in Macleod-Boynton color space, thus indicating that the binocular hue cancellation phenomenon not only occurs in the three color directions but also occupies only a small range within the color range that can be perceived by the human visual system. ObjectiveThe application of stereoscopic display, virtual reality, and head-mounted devices requires research on binocular properties of the human vision system (HVS). Threshold measurement is one method to investigate the characteristics of visual perception. At the same time, there are some color vision phenomena related to binocular vision systems that cannot be explained. One of the phenomena is called hue cancellation, which can also occur in binocular vision. Thus, it is called binocular hue cancellation and is a special phenomenon in binocular color fusion. Currently, most studies on binocular color fusion focus on the reproduction of glossiness in binocular color fusion, quantitative measurement of the thresholds of binocular color fusion, and the distinction between binocular color fusion and rivalry. However, as far as we know, no particular studies on binocular hue cancellation have been reported. To investigate the color vision mechanism of this particular phenomenon, we design a psychophysical experiment. We also investigate the opposite color directions and hue cancellation thresholds within the binocular color fusion that can perceive gray in the CIELAB color space and represent the experimental results in the LMS, Macleod-Boynton, and DKL color spaces respectively to provide experimental data for exploring the visual properties of HVS and the mechanism of binocular color.MethodsWe research a Samsung 3D display (S23A950D) with 2D/3D switching capability, requiring the observer to wear specific 3D switching glasses to obtain binocular vision. Eight opposite color directions are selected at 22.5° intervals in the isoluminance plane of CIELAB color space, and color stimulus sample pairs are selected at equal intervals in each direction (Fig. 4). The experiment is conducted among five college students between the ages of 22 and 25 with normal vision, and each of them experiences at least 19800 color stimuli. We carry out the experiment in a dark room and first employ the adjustment method to determine the opposite color directions in which the binocular hue cancellation phenomenon could occur and the initial values of the binocular hue cancellation thresholds. Then the limit method is adopted to accurately determine the binocular hue cancellation thresholds.Results and DiscussionsThe experimental results show that binocular hue cancellation phenomenon could occur only when red-green (R-G), yellow-blue (Y-B), and yellow green-purple (YG-P) color pairs are combined (Fig. 6). The binocular hue cancellation thresholds of the five observers are expressed in the CIELAB, LMS, Macleod-Boynton, and DKL color spaces respectively. In the CIELAB color space, the range of binocular hue cancellation thresholds in the R-G color direction is 11.36-13.58, with a mean value of 13.03, and the range of thresholds in the Y-B direction is 8.14-10.07, with a mean value of 9.25. The range of thresholds in the YG-P direction is 11.26-15.55, with a mean value of 13.02. Among them, the Y-B combination has the smallest threshold, and the average thresholds of the R-G and YG-P combinations are almost equal (Table 2). After exchanging the colors viewed by the left and right eyes, the obtained binocular hue cancellation thresholds are similar, which indicates that the dominant eye does not affect the binocular hue cancellation phenomenon. Five observers are largely different in thresholds of the YG-P direction, and one of them has much smaller thresholds in the R-G direction than the others, showing individual differences in the binocular hue cancellation phenomenon (Fig. 7). In the LMS color space, the six color directions are uniformly distributed and almost divide the L-M plane into six equal parts. The color directions in the L-M plane and the L-S plane are symmetric about the S axis, and the thresholds in the L-M plane are shown as a straight line parallel to the S axis (Fig. 8). In the Macleod-Boynton chromaticity diagram, the binocular hue cancellation thresholds of six colors are close to the white point, indicating the saturation of the colors which can produce the binocular hue cancellation phenomenon is low (Fig. 9). In DKL space, the direction of YG-P overlaps with the cardinal direction S-(L+M), while the directions of R-G, Y-B, and the cardinal direction L-M are not close to each other (Fig. 10).ConclusionsThe binocular hue cancellation phenomenon is investigated through a visual psychophysics experimental method. The results show that the particular phenomenon can only occur in three color directions of red-green, yellow-blue, and yellow green-purple, which means observers can only perceive gray in the three directions. There are individual differences in binocular hue cancellation thresholds of the five observers, but the thresholds in the yellow-blue direction are all minimal. Because the study on visual mechanisms is strongly related to the choice of color space, the binocular hue cancellation thresholds of the five observers are expressed in the color spaces of CIELAB, LMS, Macleod-Boynton, and DKL respectively. The binocular hue cancellation directions are more uniformly distributed in LMS, Macleod-Boynton, and DKL color space approximately in six equal parts, implying the specificity of these six hues. The binocular hue cancellation threshold occupies only a small range in Macleod-Boynton color space, thus indicating that the binocular hue cancellation phenomenon not only occurs in the three color directions but also occupies only a small range within the color range that can be perceived by the human visual system.
Acta Optica Sinica
- Publication Date: Jul. 10, 2023
- Vol. 43, Issue 13, 1333001 (2023)

Performance of CIE 2006 Color Matching Functions in Different Fields of View
Yu Wang, Min Huang, Yu Li, Xinyuan Gao, Yuetong Shen, and Jiong Liang
ObjectiveColor matching functions (CMFs) play a critical role in color science and management. Accurate colorimetry starts with accurate CMFs. Due to changes in the cone pigment optical densities and macular pigment at different retinal locations, different CMFs are required for different fields of view (FOVs). Currently, the CIE 1931 2° CMFs are recommended for a FOV between 1° and 4°, while the CIE 1964 10° CMFs are recommended for a FOV beyond 4°. In 2006, the committee derived a model to estimate the cone fundamentals for normal observers with a FOV ranging from 1° to 10°. With the development of wide color gamut displays and display devices for different application scenarios, several recent studies have disclosed that the field size can have a large impact on CMFs, and hence the colorimetric values are derived from them. It is worth systematically investigating the accuracy and performance of the CMFs recommended by International Commission on illumination (CIE) concerning the parameter of FOVs.MethodsIn this study, a series of color matching experiments using spectrally narrowband primaries are performed. Firstly, we select LED panels with red, green, and blue colors of 636 nm, 524 nm, and 448 nm as the target set (named L1 set), and the peak wavelengths of these three primaries are generally similar to those used in Stiles and Burch (i.e., 645.2, 526.3, and 444.4 nm), with wavelength shifts of below 10 nm, which are found to introduce a small degree of observer metamerism. Meanwhile, the L2 (676 nm-524 nm-448 nm) and L4 (636 nm-524 nm-472 nm) are selected as the matched primary sets. Then, three colors including red and blue from the five colors recommended by CIE and white are randomly presented with the L1 target set. After that, forty-five color normal observers are organized to carry out the color matching experiments in four FOVs (2.9°, 5.7°, 8.6°, and 11.0°). Finally, the spectral power distributions (SPDs) of the target and the matched colors are measured immediately.Results and DiscussionsThe SPDs of the target and the matched colors are measured and calculated by CMFs recommended by CIE, including CIE 1931 2°, CIE 1964 10°, and CIE 2006 (1°-10°) CMFs with the indices of color matching accuracy and inter-observer variability ellipses. The Δ(u',v') values are used to test the color matching accuracies, and the results indicate that the CIE 2006 2° CMFs have the best performance in small FOV (below 4°), and the CIE 2006 3° CMFs has the best performance in large FOV (beyond 4°) (Fig. 3). In addition, the chromaticity differences Δ(u',v') with different CIE CMFs between the average chromaticity of three stimuli adjusted by the observers in the four FOVs using the L2 and L4 sets are compared (Table 4). The CIE 1931 2° CMFs have the worst performance in white and red stimuli, while CIE 2006 10 ° CMFs perform the worst in the blue stimulus in the four FOVs. On the whole, the CIE 2006 2°, CIE 2006 3°, and CIE 2006 4° CMFs have the best performances except for the red stimulus in large FOVs and the blue stimulus in small FOV. The 95% confidence ellipses of the chromaticity adjusted by the observers, which are calculated by using different CMFs, are used to express the observer metamerism (Fig. 5). The observer metamerism in small FOV (below 4°) is smaller than that in large FOV(beyond 4°), and the smallest observer metamerism occurs in the white stimulus, followed by the red stimulus, and the blue stimulus has the largest observer metamerism.ConclusionsThis article reports the results of a series of color matching experiments by using narrowband LED primaries under 2.9°, 5.7°, 8.6°, and 11.0° FOVs conditions. In terms of color matching accuracy, the results indicate that in small FOVs, the 2006 2° standard observer CMFs recommended by CIE for small field sizes (below 4°) is confirmed. The results also indicate that among the CIE standard CMFs, the CIE 2006 3° CMFs have a higher predictive performance than the CIE 2006 10° CMFs and CIE 1964 10° CMFs for the field size beyond 4°, which will not support the CIE's recommendation. The CIE 2006 10° CMFs have overestimated the blue cone response in large FOV, which is needed to be improved. In FOV of 2.9°, the color perception tends to be magenta compared with colors matched in large FOV, especially the blue stimulus in the L4 (with the shift of blue primary) primary set. In terms of observer metamerism, a discrepancy of blue cone distribution in retinal occurs among different observers, which will lead to the largest observer metamerism in the blue stimulus, as well as in small FOV (below 4°). With fewer blue cones, the observer metamerism will be smaller than that in large FOV (beyond 4°). The parameters of FOV in CIE 2006 CMFs are needed to be improved and modified when the colors in different displays in the larger FOV are calculated and calibrated. ObjectiveColor matching functions (CMFs) play a critical role in color science and management. Accurate colorimetry starts with accurate CMFs. Due to changes in the cone pigment optical densities and macular pigment at different retinal locations, different CMFs are required for different fields of view (FOVs). Currently, the CIE 1931 2° CMFs are recommended for a FOV between 1° and 4°, while the CIE 1964 10° CMFs are recommended for a FOV beyond 4°. In 2006, the committee derived a model to estimate the cone fundamentals for normal observers with a FOV ranging from 1° to 10°. With the development of wide color gamut displays and display devices for different application scenarios, several recent studies have disclosed that the field size can have a large impact on CMFs, and hence the colorimetric values are derived from them. It is worth systematically investigating the accuracy and performance of the CMFs recommended by International Commission on illumination (CIE) concerning the parameter of FOVs.MethodsIn this study, a series of color matching experiments using spectrally narrowband primaries are performed. Firstly, we select LED panels with red, green, and blue colors of 636 nm, 524 nm, and 448 nm as the target set (named L1 set), and the peak wavelengths of these three primaries are generally similar to those used in Stiles and Burch (i.e., 645.2, 526.3, and 444.4 nm), with wavelength shifts of below 10 nm, which are found to introduce a small degree of observer metamerism. Meanwhile, the L2 (676 nm-524 nm-448 nm) and L4 (636 nm-524 nm-472 nm) are selected as the matched primary sets. Then, three colors including red and blue from the five colors recommended by CIE and white are randomly presented with the L1 target set. After that, forty-five color normal observers are organized to carry out the color matching experiments in four FOVs (2.9°, 5.7°, 8.6°, and 11.0°). Finally, the spectral power distributions (SPDs) of the target and the matched colors are measured immediately.Results and DiscussionsThe SPDs of the target and the matched colors are measured and calculated by CMFs recommended by CIE, including CIE 1931 2°, CIE 1964 10°, and CIE 2006 (1°-10°) CMFs with the indices of color matching accuracy and inter-observer variability ellipses. The Δ(u',v') values are used to test the color matching accuracies, and the results indicate that the CIE 2006 2° CMFs have the best performance in small FOV (below 4°), and the CIE 2006 3° CMFs has the best performance in large FOV (beyond 4°) (Fig. 3). In addition, the chromaticity differences Δ(u',v') with different CIE CMFs between the average chromaticity of three stimuli adjusted by the observers in the four FOVs using the L2 and L4 sets are compared (Table 4). The CIE 1931 2° CMFs have the worst performance in white and red stimuli, while CIE 2006 10 ° CMFs perform the worst in the blue stimulus in the four FOVs. On the whole, the CIE 2006 2°, CIE 2006 3°, and CIE 2006 4° CMFs have the best performances except for the red stimulus in large FOVs and the blue stimulus in small FOV. The 95% confidence ellipses of the chromaticity adjusted by the observers, which are calculated by using different CMFs, are used to express the observer metamerism (Fig. 5). The observer metamerism in small FOV (below 4°) is smaller than that in large FOV(beyond 4°), and the smallest observer metamerism occurs in the white stimulus, followed by the red stimulus, and the blue stimulus has the largest observer metamerism.ConclusionsThis article reports the results of a series of color matching experiments by using narrowband LED primaries under 2.9°, 5.7°, 8.6°, and 11.0° FOVs conditions. In terms of color matching accuracy, the results indicate that in small FOVs, the 2006 2° standard observer CMFs recommended by CIE for small field sizes (below 4°) is confirmed. The results also indicate that among the CIE standard CMFs, the CIE 2006 3° CMFs have a higher predictive performance than the CIE 2006 10° CMFs and CIE 1964 10° CMFs for the field size beyond 4°, which will not support the CIE's recommendation. The CIE 2006 10° CMFs have overestimated the blue cone response in large FOV, which is needed to be improved. In FOV of 2.9°, the color perception tends to be magenta compared with colors matched in large FOV, especially the blue stimulus in the L4 (with the shift of blue primary) primary set. In terms of observer metamerism, a discrepancy of blue cone distribution in retinal occurs among different observers, which will lead to the largest observer metamerism in the blue stimulus, as well as in small FOV (below 4°). With fewer blue cones, the observer metamerism will be smaller than that in large FOV (beyond 4°). The parameters of FOV in CIE 2006 CMFs are needed to be improved and modified when the colors in different displays in the larger FOV are calculated and calibrated.
Acta Optica Sinica
- Publication Date: Jun. 10, 2023
- Vol. 43, Issue 11, 1133001 (2023)
Production of Driven Images for Wide-Color-Gamut Multi-Primary Display Systems
Yasheng Li, Ningfang Liao, Yumei Li, Songlin Li, Wenmin Wu, and Qiumei Fan
ObjectiveWide-color-gamut display systems play an important role in the fields of electronic commerce, digital archives, design, simulation, and medical systems. In contrast to conventional three-primary display systems whose color gamut is limited to a triangle area, multi-primary display systems are more appropriate for wide-color-gamut display thanks to their larger polygonal color gamut. Nowadays, various multi-primary display systems have been put forward, such as four-primary, five-primary, and six-primary display systems. The theoretical studies of multi-primary display mainly focus on the conversion models between the multi-primary space and the standard CIE XYZ color space. However, the acquisition or production of driven images remains difficult for multi-primary display. It is a challenge for a conventional camera to capture color images which match multi-primary display with a wide color gamut. Besides, the driven images of multi-primary display have more than three channels, and thus they cannot be produced directly from three-primary images due to metamerism. In this paper, we introduce multi-primary LED dot matrix display, which has the advantages of a large size, a wide color gamut, high brightness, and a large dynamic range. To drive multi-primary LED dot matrix display with correct color reproduction, we propose a method to produce driven images for multi-primary display systems by using a conventional RGB camera. We hope that our method can be helpful for wide-color-gamut multi-primary display.MethodsWe measured the spectral sensitivity of four typical digital cameras, including Canon 1000D, Fuji X-E3, Nikon J1, and Sony F828, and analyzed their color acquisition ability. In light of the colorimetry theory and with numerical methods, we built a forward model which can convert the n-primary space of a display system to the standard CIE XYZ color space and then built an inverse model for the conversion from three-primary space to n-primary space by using a look-up table from three-dimensional space to n-dimensional space. A five-primary LED dot matrix display system was simulated utilizing typical LED components, and the ColorChecker SG target with a wide color gamut was used as the target image. We experimented with our conversion method on this five-primary LED dot matrix display system.Results and DiscussionsSince the target image is a raw color image of the ColorChecker SG target and its color gamut exceeds the sRGB gamut, it has the characteristics of a wide color gamut. If the illumination is changed, such as using a high-chroma light source, its color gamut can be further increased. When the colorimetric parameters of the five-primary LED dot matrix display are determined, the forward model can be easily built according to the proposed method. The chromatic aberration of 96 color blocks is mostly less than 2. Reducing the step size can lower the chromatic aberration of individual color blocks. The step-size parameter in the experiment is set as 25, which is the result of balancing the chromatic aberration and the calculation speed. The experimental results show that our method can produce images with the use of an RGB camera for driving the five-primary LED display system, and desired color reproduction can be achieved. There are some non-uniform distributions in the five-primary driven images, which will not affect the final display result.ConclusionsThe colorimetry theory and numerical methods help build a forward model and an inverse model for image conversion between the n-primary space of an LED dot matrix display system and the three-primary space of a CIE1931 XYZ system. The experimental results demonstrate that our models can easily produce multi-primary images from wide-color-gamut RGB images for driving LED dot matrix display and achieve desired color reproduction. Next, our work will focus on improvements in the color reproduction accuracy, the color gamut of the target image, the uniformity of the primary images, and the production speed of multi-primary images. It should be noted that our method is based on the assumption that the n-primary display system is in line with the principle of linear superposition, which is suitable for LED display systems. The method is promising in wide-color-gamut multi-primary display systems whose channels are highly independent. ObjectiveWide-color-gamut display systems play an important role in the fields of electronic commerce, digital archives, design, simulation, and medical systems. In contrast to conventional three-primary display systems whose color gamut is limited to a triangle area, multi-primary display systems are more appropriate for wide-color-gamut display thanks to their larger polygonal color gamut. Nowadays, various multi-primary display systems have been put forward, such as four-primary, five-primary, and six-primary display systems. The theoretical studies of multi-primary display mainly focus on the conversion models between the multi-primary space and the standard CIE XYZ color space. However, the acquisition or production of driven images remains difficult for multi-primary display. It is a challenge for a conventional camera to capture color images which match multi-primary display with a wide color gamut. Besides, the driven images of multi-primary display have more than three channels, and thus they cannot be produced directly from three-primary images due to metamerism. In this paper, we introduce multi-primary LED dot matrix display, which has the advantages of a large size, a wide color gamut, high brightness, and a large dynamic range. To drive multi-primary LED dot matrix display with correct color reproduction, we propose a method to produce driven images for multi-primary display systems by using a conventional RGB camera. We hope that our method can be helpful for wide-color-gamut multi-primary display.MethodsWe measured the spectral sensitivity of four typical digital cameras, including Canon 1000D, Fuji X-E3, Nikon J1, and Sony F828, and analyzed their color acquisition ability. In light of the colorimetry theory and with numerical methods, we built a forward model which can convert the n-primary space of a display system to the standard CIE XYZ color space and then built an inverse model for the conversion from three-primary space to n-primary space by using a look-up table from three-dimensional space to n-dimensional space. A five-primary LED dot matrix display system was simulated utilizing typical LED components, and the ColorChecker SG target with a wide color gamut was used as the target image. We experimented with our conversion method on this five-primary LED dot matrix display system.Results and DiscussionsSince the target image is a raw color image of the ColorChecker SG target and its color gamut exceeds the sRGB gamut, it has the characteristics of a wide color gamut. If the illumination is changed, such as using a high-chroma light source, its color gamut can be further increased. When the colorimetric parameters of the five-primary LED dot matrix display are determined, the forward model can be easily built according to the proposed method. The chromatic aberration of 96 color blocks is mostly less than 2. Reducing the step size can lower the chromatic aberration of individual color blocks. The step-size parameter in the experiment is set as 25, which is the result of balancing the chromatic aberration and the calculation speed. The experimental results show that our method can produce images with the use of an RGB camera for driving the five-primary LED display system, and desired color reproduction can be achieved. There are some non-uniform distributions in the five-primary driven images, which will not affect the final display result.ConclusionsThe colorimetry theory and numerical methods help build a forward model and an inverse model for image conversion between the n-primary space of an LED dot matrix display system and the three-primary space of a CIE1931 XYZ system. The experimental results demonstrate that our models can easily produce multi-primary images from wide-color-gamut RGB images for driving LED dot matrix display and achieve desired color reproduction. Next, our work will focus on improvements in the color reproduction accuracy, the color gamut of the target image, the uniformity of the primary images, and the production speed of multi-primary images. It should be noted that our method is based on the assumption that the n-primary display system is in line with the principle of linear superposition, which is suitable for LED display systems. The method is promising in wide-color-gamut multi-primary display systems whose channels are highly independent.
Acta Optica Sinica
- Publication Date: Jan. 10, 2023
- Vol. 43, Issue 1, 0133001 (2023)
Illumination Spectrum Estimation Method Based on Single Multispectral Image
Yang Lu, and Haisong Xu
The spectral information of the scene is affected by different illumination conditions, hence the spectral reflectance reconstruction of multispectral images taken under scenes with uncontrollable illumination requires illumination spectrum estimation. Therefore, a general method based on a single multispectral image is proposed to accurately predict the illumination spectrum of the scene. First, by analyzing the response features of each pixel, the chroma weight map is designed and calculated to find the pixels that contain more illumination information. Then, the component analysis of the weighted image is carried out to extract the illuminant response features in the channel domain. Finally, benefiting from the innovative introduction of the dictionary learning method trained by illumination spectrum library, the relative spectral power distribution of the scene illuminant can be estimated. The average angular errors of the illumination spectrum estimation obtained by the proposed method on simulated data and real data are 0.29 and 3.42, respectively. Compared with the existing counterparts, the proposed method shows better accuracy and robustness. The spectral information of the scene is affected by different illumination conditions, hence the spectral reflectance reconstruction of multispectral images taken under scenes with uncontrollable illumination requires illumination spectrum estimation. Therefore, a general method based on a single multispectral image is proposed to accurately predict the illumination spectrum of the scene. First, by analyzing the response features of each pixel, the chroma weight map is designed and calculated to find the pixels that contain more illumination information. Then, the component analysis of the weighted image is carried out to extract the illuminant response features in the channel domain. Finally, benefiting from the innovative introduction of the dictionary learning method trained by illumination spectrum library, the relative spectral power distribution of the scene illuminant can be estimated. The average angular errors of the illumination spectrum estimation obtained by the proposed method on simulated data and real data are 0.29 and 3.42, respectively. Compared with the existing counterparts, the proposed method shows better accuracy and robustness.
Acta Optica Sinica
- Publication Date: Mar. 28, 2022
- Vol. 42, Issue 7, 0733001 (2022)
Calculation of Correlated Color Temperature and Color Deviation of Light Source Based on Hybrid Polynomial Method
Cheng Gao, Yue Li, and Changjun Li
Since the calculation of correlated color temperature and color deviation of light source has always been the focus of researchers, an efficient hybrid method based on triangle method, parabolic method, and third-order polynomial method for calculating correlated color temperature and color deviation of light source is proposed. The accuracy of the proposed method is tested and compared with that of Ohno and Robertson methods by using 90005 data sampled from 18001 isotemperature lines with colour temperature between 2000 K and 20000 K at 1 K step, and color deviation between -0.030 and 0.030 at 0.015 step. The test results show that the proposed method is better than Ohno and Robertson methods with maximum absolute difference of correlated color temperature being less than 0.3858 K and maximum absolute difference of color deviation being less than 3.33×10 -6 respectively, so it can be directly used in LED spectrum optimization and design. Since the calculation of correlated color temperature and color deviation of light source has always been the focus of researchers, an efficient hybrid method based on triangle method, parabolic method, and third-order polynomial method for calculating correlated color temperature and color deviation of light source is proposed. The accuracy of the proposed method is tested and compared with that of Ohno and Robertson methods by using 90005 data sampled from 18001 isotemperature lines with colour temperature between 2000 K and 20000 K at 1 K step, and color deviation between -0.030 and 0.030 at 0.015 step. The test results show that the proposed method is better than Ohno and Robertson methods with maximum absolute difference of correlated color temperature being less than 0.3858 K and maximum absolute difference of color deviation being less than 3.33×10 -6 respectively, so it can be directly used in LED spectrum optimization and design.
Acta Optica Sinica
- Publication Date: Mar. 06, 2022
- Vol. 42, Issue 5, 0533003 (2022)
Progressive Multi-Scale Feature Cascade Fusion Color Constancy Algorithm
Zepeng Yang, Kai Xie, and Tong Li
Color constancy is an important prerequisite for computer vision tasks such as object detection, three-dimensional object reconstruction, and automatic driving. In order to make full use of the feature information of different scales in the image to estimate the light source, a progressive multi-scale feature cascade fusion color constancy algorithm is proposed. The feature information in the image is extracted from different scales by three convolution network branches to fuse and get more abundant feature information. By cascading the shallow edge information and the deep fine-grained feature information in the image, the accuracy of the color constancy algorithm is improved. The progressive network structure improves the robustness of the algorithm for the light source estimation in extreme scenes by weighted cumulative angle error loss function. Experimental results on the reprocessed ColorChecker and NUS-8 datasets show that the proposed algorithm outperforms the current color constancy algorithm in terms of various evaluation indexes, and can be applied to other computer vision tasks requiring color constancy preprocessing. Color constancy is an important prerequisite for computer vision tasks such as object detection, three-dimensional object reconstruction, and automatic driving. In order to make full use of the feature information of different scales in the image to estimate the light source, a progressive multi-scale feature cascade fusion color constancy algorithm is proposed. The feature information in the image is extracted from different scales by three convolution network branches to fuse and get more abundant feature information. By cascading the shallow edge information and the deep fine-grained feature information in the image, the accuracy of the color constancy algorithm is improved. The progressive network structure improves the robustness of the algorithm for the light source estimation in extreme scenes by weighted cumulative angle error loss function. Experimental results on the reprocessed ColorChecker and NUS-8 datasets show that the proposed algorithm outperforms the current color constancy algorithm in terms of various evaluation indexes, and can be applied to other computer vision tasks requiring color constancy preprocessing.
Acta Optica Sinica
- Publication Date: Apr. 17, 2022
- Vol. 42, Issue 5, 0533002 (2022)
Topics
© Copyright 2018-2021 | Chinese Laser Press. All Rights Reserved 沪ICP备15018463号-20